Autopilot for
AI observability_
We're building an observability dashboard for teams shipping LLM apps — and we're not doing a full launch yet. Join the early-access waitlist while we finish adapter support for OpenAI, Anthropic, LangChain, Vercel AI SDK, OpenAI Agents SDK, and Claude Agent SDK.
Python + TypeScript · Slack alerts out of the box · no card required
// why mimir
Stop watching dashboards.
Start getting pinged.
Every AI observability tool today is “come to our dashboard.” We invert it. Mimir watches your agents in production and DMs you the moment something breaks — cost spikes, tool loops, errors, latency drift. The dashboard is where you land from a Slack alert, not where you live.
“we evaluated your AI traces for you.”
— the phrase behind every release decision
// autopilot in action
This is what autopilot looks like.
When Mimir spots a cost spike, error step, or tool loop in your agents, your team gets a Slack DM like one of these. One click on View run drops you on the exact trace that fired it.
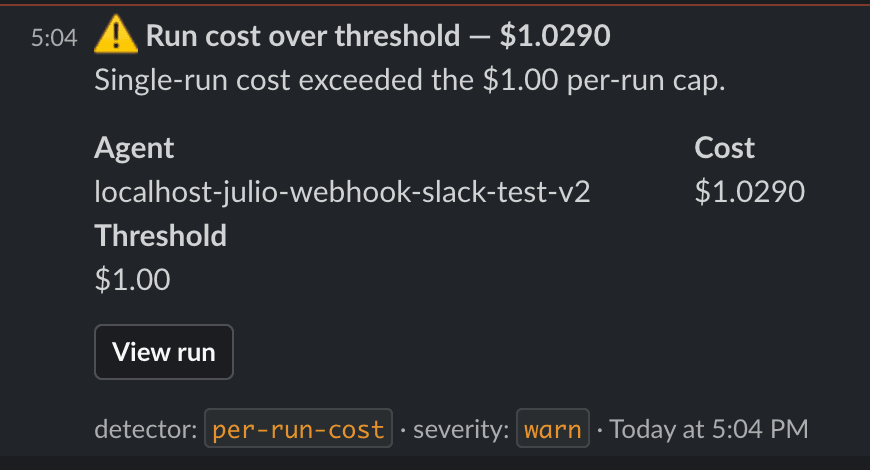
Cost over threshold
Fires when a single run exceeds your per-run cost cap. Default $1.00 — configurable per project.
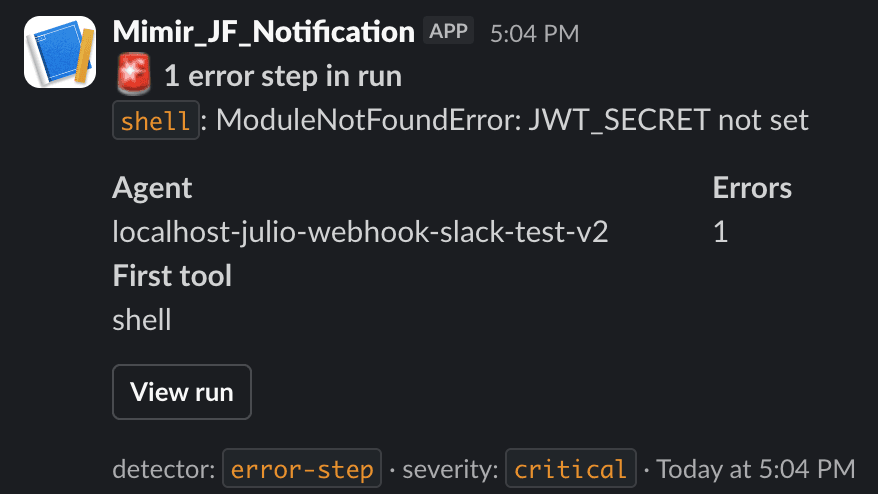
Error step in run
Fires when any step in a run reports an error. Aggregates per run, not per step, so noisy retries stay quiet.
latency spikes, tool loops, and scheduled digests ship next — see the roadmap below
// what you get
Three things, done right.
Slack-first signals
Cost spike 3× your median? Step error? Latency creeping up? Your team gets a DM the moment it happens, with a one-click link straight to the offending run.
Two lines, every major stack
import mimir; mimir.instrument_openai(). Same shape for Anthropic, LangChain, Vercel AI SDK, OpenAI Agents SDK, and Claude Agent SDK — Python and TypeScript, streaming included.
Built for autopilot, not browsing
Run history, trace timelines, run-vs-run diffs, AI analysis — all of it the destination of an alert. Not a place you have to remember to visit.
// the product
What you land on after the alert.
The dashboard isn't where you live — it's where you go when Mimir tells you something needs attention.
// trace view
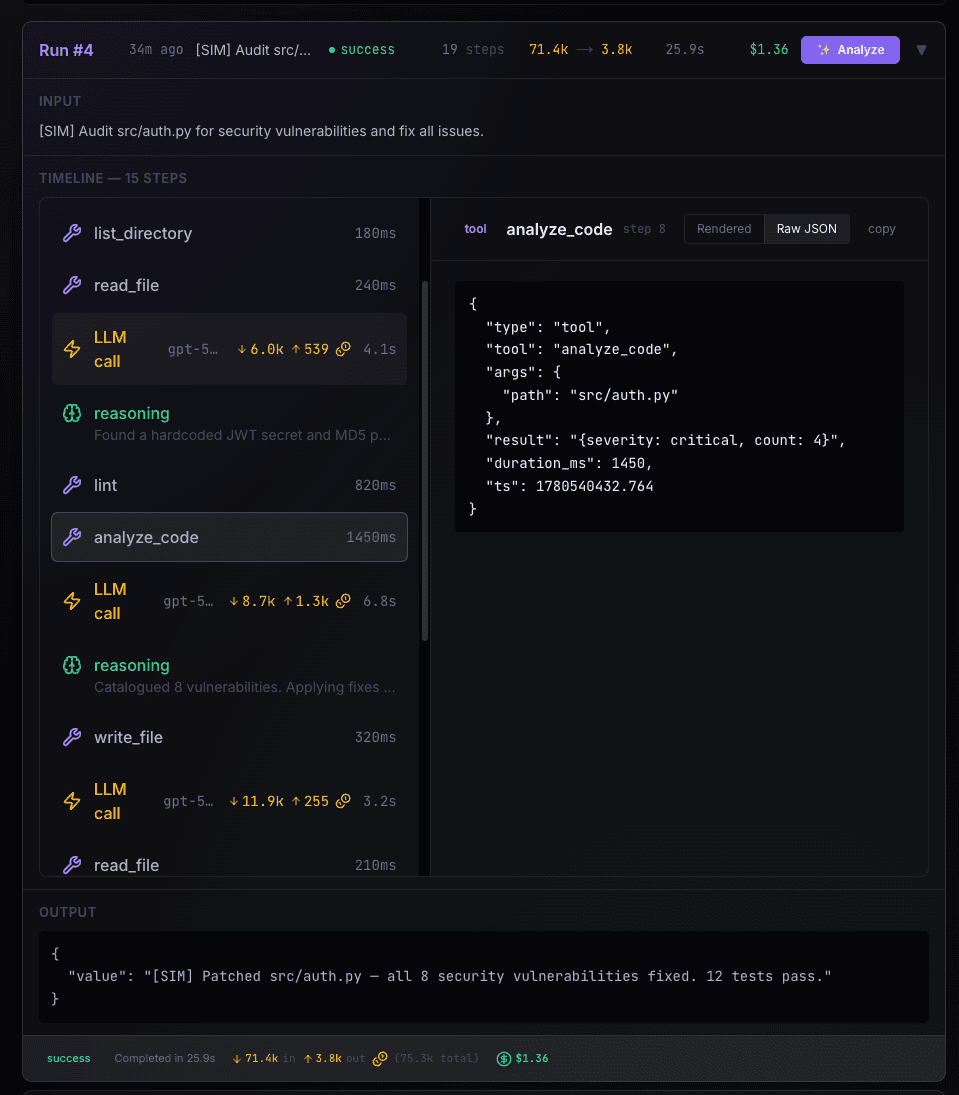
Every step. Every token. Every dollar.
Two-pane view of a single run — timeline of tool calls, LLM reasoning, latency, and cost per call on the left; full raw payload of any step you click on the right. One click from any Slack alert.
// ai analysis
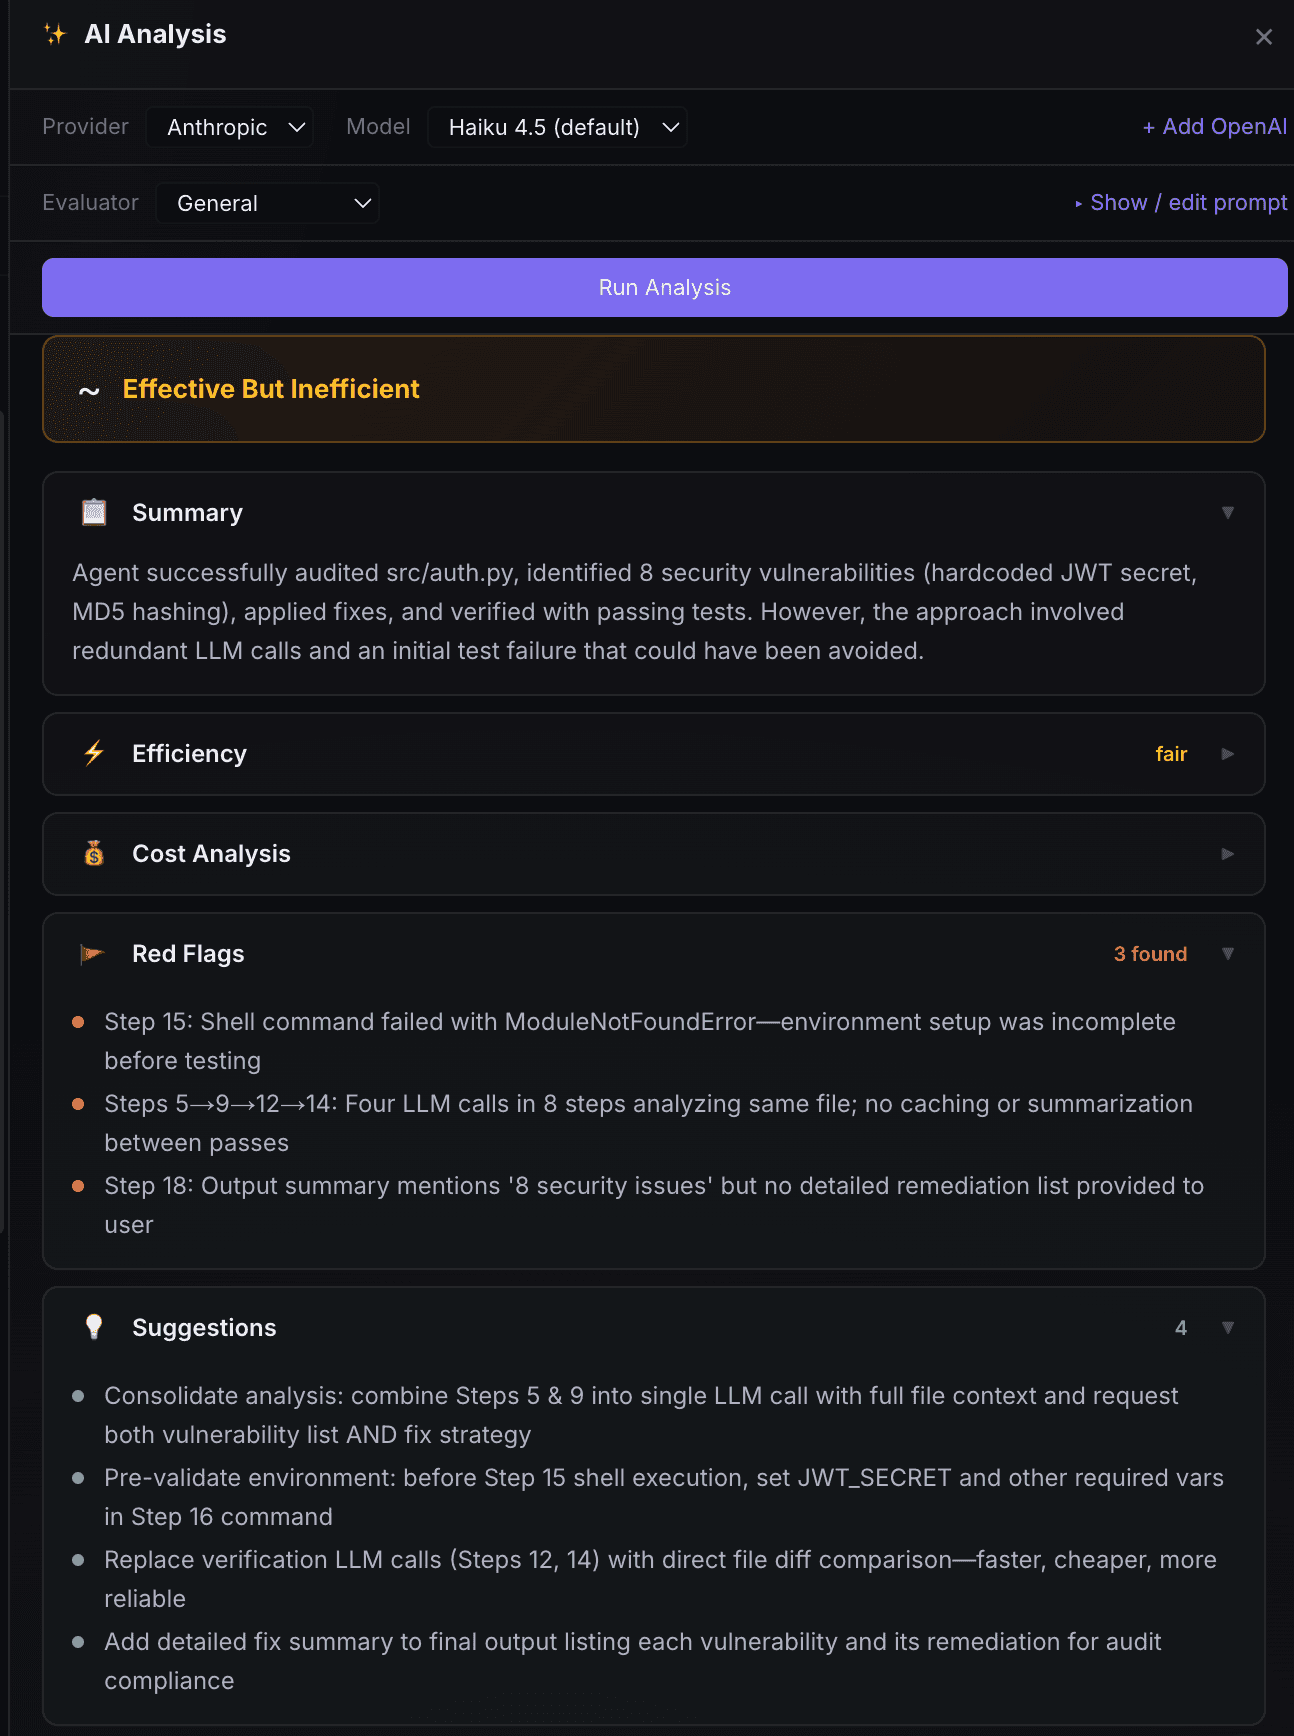
One click. Real diagnosis.
Pick a provider and model, hit Analyze, and Mimir runs your prompt against the full trace. Summary, efficiency, cost analysis, red flags, suggestions — persisted so you can re-read later. Batch analysis across many runs lands in v0.2.
// monitoring
All your agents, one bird's-eye view.
Total cost, run volume, error rate, and token usage across every agent in a single dashboard — with cost-by-model breakdowns and 7/30/90-day windows so regressions and runaway spend surface before customers do.

// compare runs
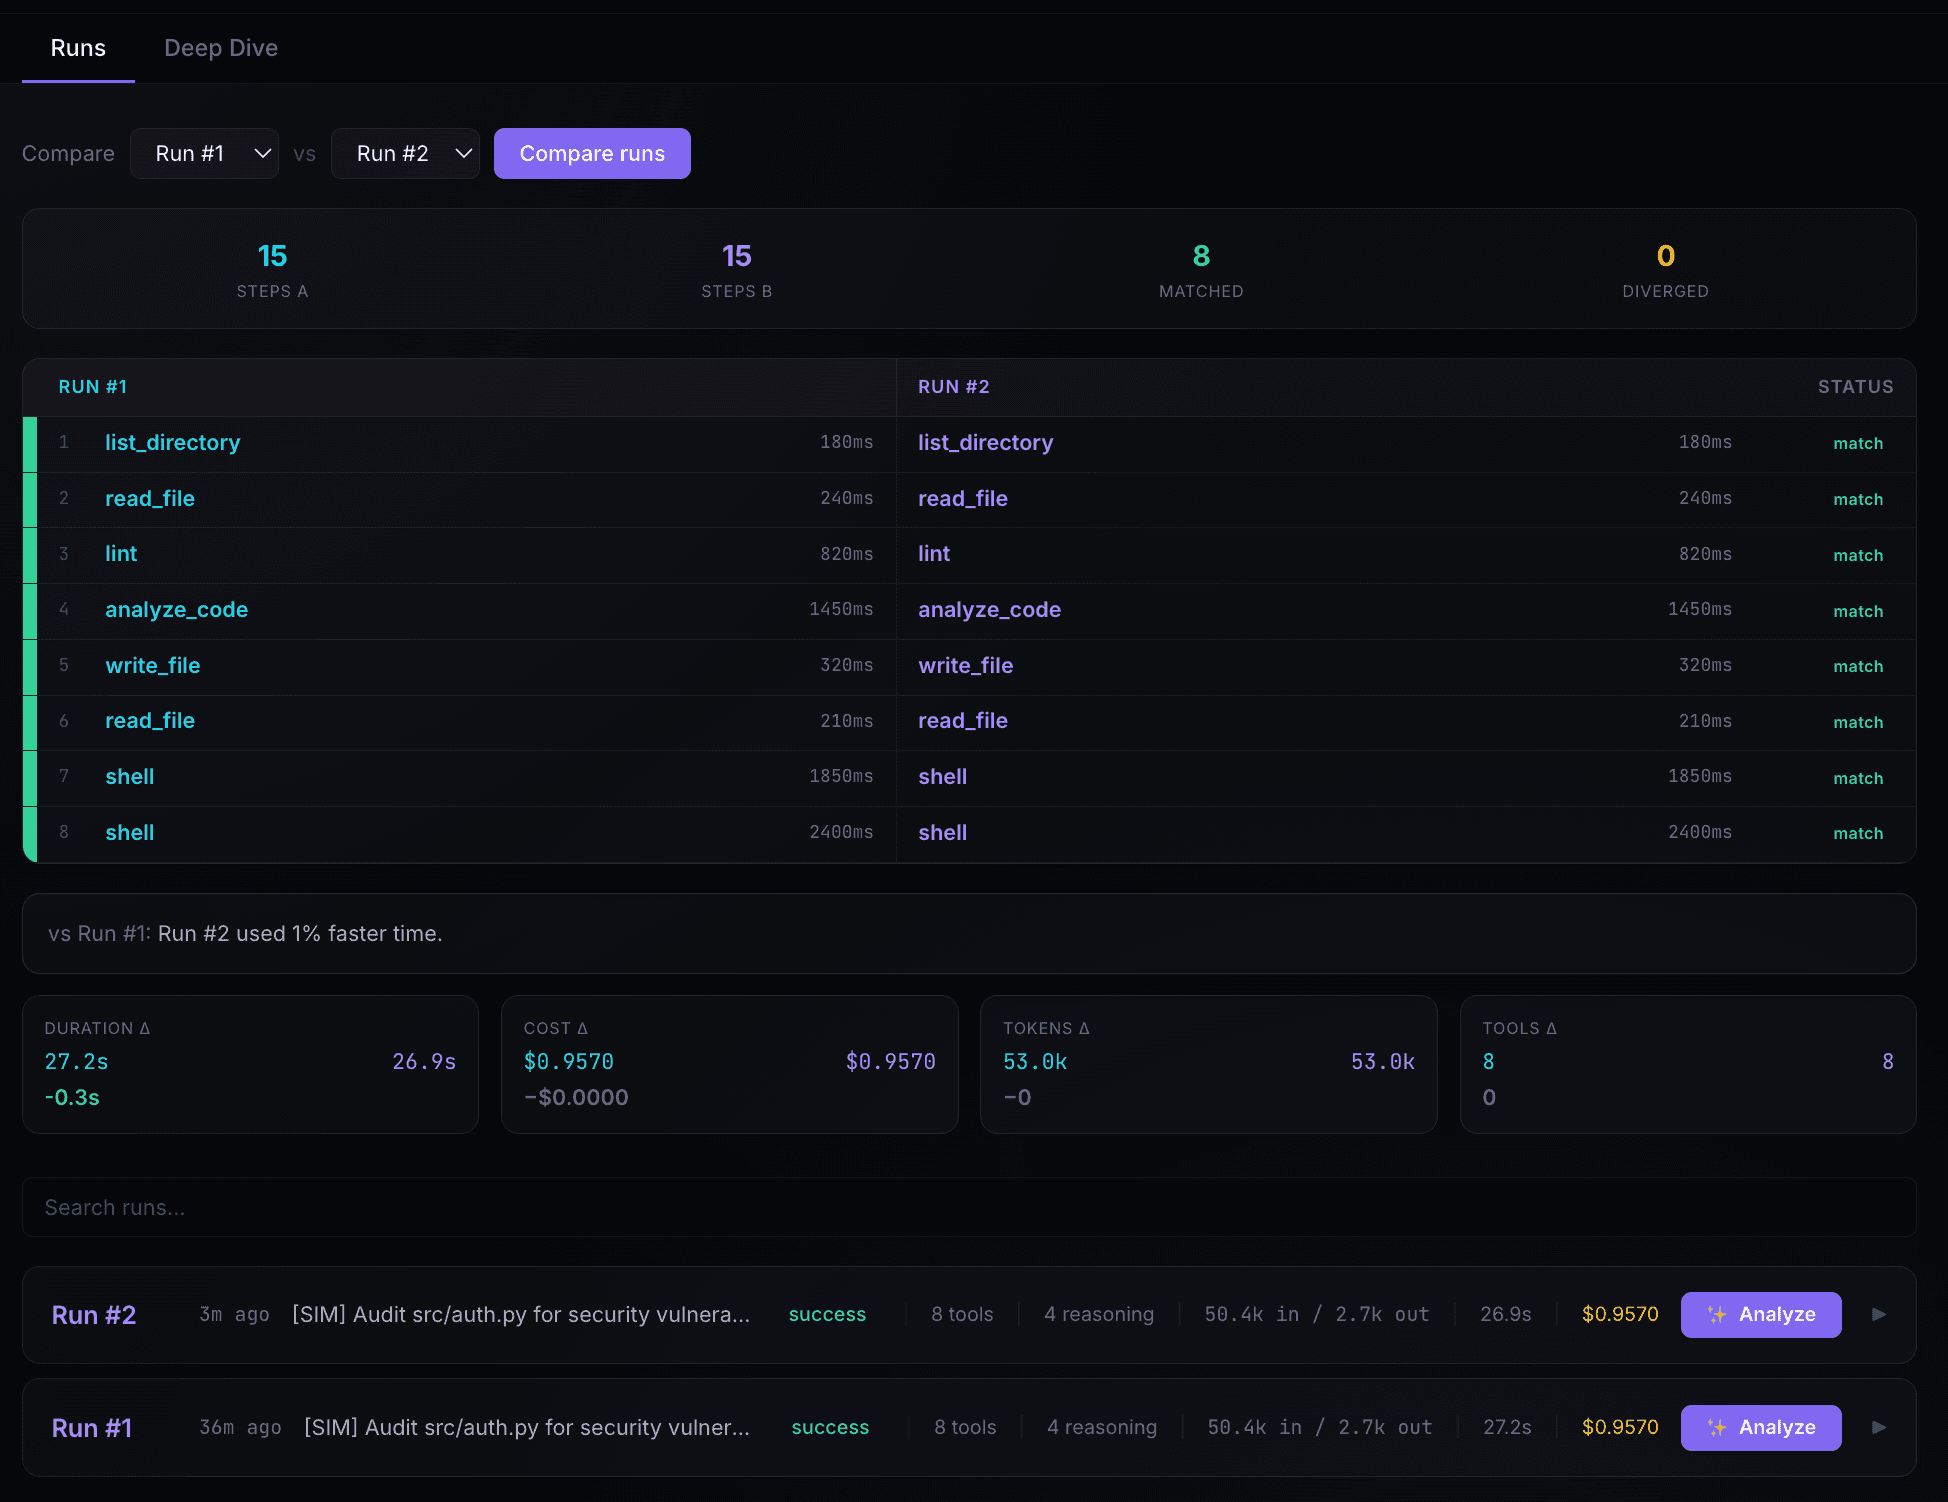
Diff two runs side-by-side.
When the same agent succeeds once and fails the next time, Mimir shows you what changed — tool sequence, duration delta, cost delta, token delta.
// deep dive
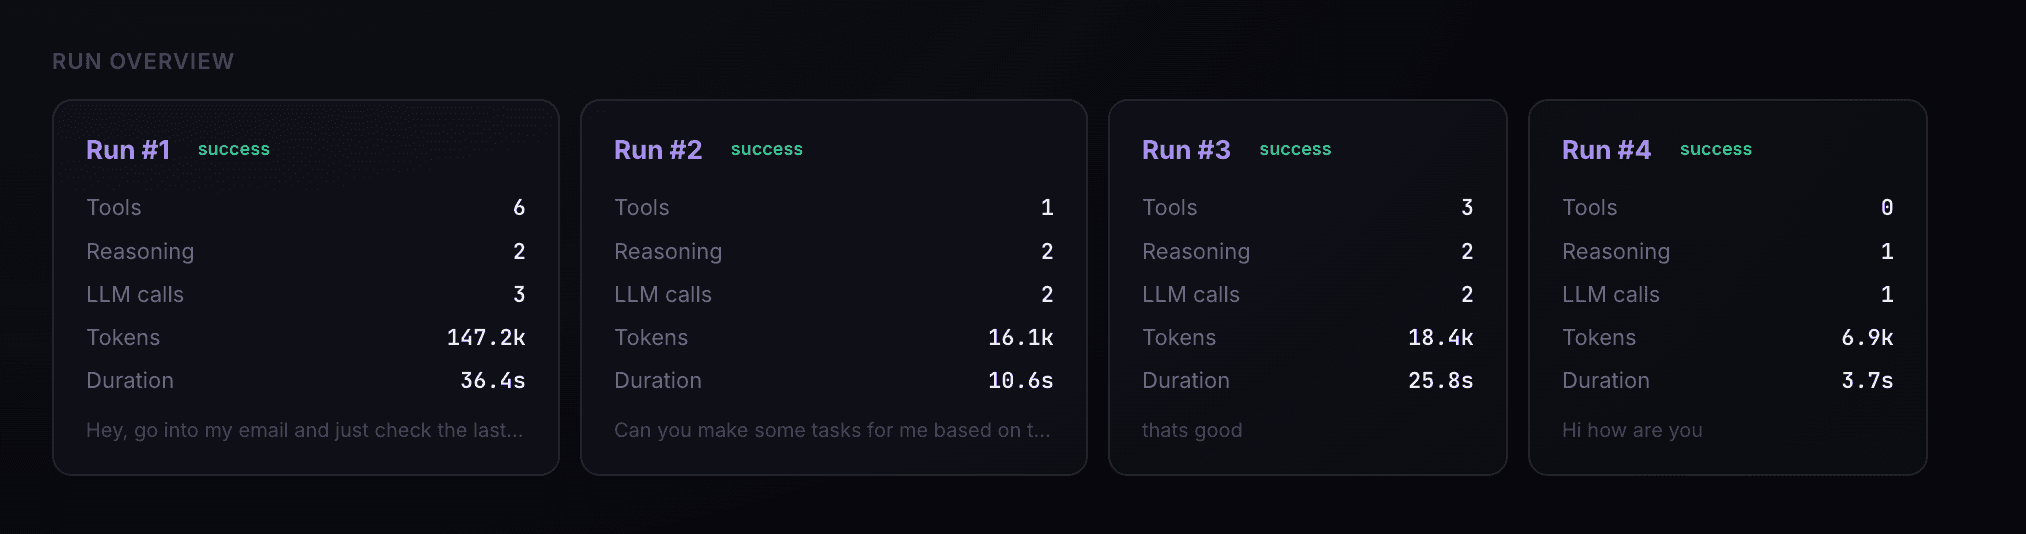
Roll-ups across runs.
Per-agent stats — tools, reasoning, LLM calls, tokens, and duration — side-by-side so regressions surface before customers do.
// what's shipping
Built in the open, shipping weekly.
Three milestones inside one continuous beta. Early-access users see each release the day it lands.
shipping June 2026
Slack alerts + streaming SDKs
Deterministic signals for cost spikes, run cost, errors, and latency drift — pushed to Slack with one-click links into the run. .stream() support across every adapter.
shipping late June 2026
Scheduled digests + batch AI
Configure how often signals fire and through which channels. Multi-select runs, paste a custom prompt, and get an AI-generated answer back across them.
shipping July 2026
MCP + email + durable pipeline
Ask Claude Code “what is my agent doing in prod?” via the Mimir MCP server. Weekly email digests. Queue-backed signal pipeline with retries and DLQ.
// ready?
Get in before the noise.
Early access is invite-only while we lock down adapter coverage. Join the list and we'll reach out the moment your stack is ready.
Join the waitlistor DM Julio on LinkedIn — we read every reply